Elliot Waves analysis

Elliot Waves
The tool leverages machine learning techniques and Elliott Wave Theory to provide insights into potential market movements. Below are the key components and functionalities of the tool.
Overview
This tool is designed to help users predict the price movements of cryptocurrencies by analyzing historical market data. It uses Binance as the data source and applies advanced techniques such as XGBoost regression models and Elliott Wave analysis to forecast trends.
Key Features
- Market Data Retrieval: The tool fetches historical price data from Binance, allowing users to analyze specific cryptocurrencies over various time intervals.
- Elliott Wave Analysis: It identifies potential Elliott Waves within the price data, which helps in understanding market trends, whether bullish (upward) or bearish (downward).
- Price Prediction: Using machine learning models, the tool predicts future prices, providing users with insights into potential market directions.
- Visual Representation: The tool generates candlestick charts with overlaid predicted Elliott Waves, making it easier for users to visualize market trends and predictions.
How It Works
1. Fetching Market Data
The tool connects to Binance and retrieves historical price data for the selected cryptocurrency and interval (e.g., 1-hour, 1-day). This data includes open, high, low, and close prices, as well as trading volume.
2. Elliott Wave Analysis
Once the data is retrieved, the tool applies Elliott Wave Theory to identify potential wave patterns in the price movements. Elliott Waves are a technical analysis tool that helps predict future market behavior by identifying recurring patterns in the market.
3. Price Prediction
The core of the tool's predictive capability lies in its use of the XGBoost regression model. This machine learning model is trained on historical data to recognize patterns and predict future prices. The tool generates a series of predicted prices for the next few periods based on this model.
4. Visualizing Trends
To help users interpret the analysis, the tool generates charts that display the historical price data as candlesticks, with predicted Elliott Waves and future prices overlaid. These charts provide a clear and concise view of the market's potential direction.
Usage
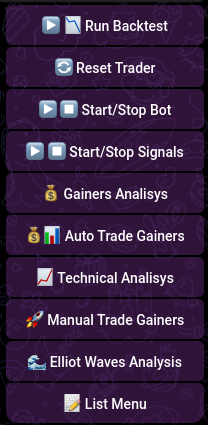
- Select Elliot Waves analysis from the menu.
- Enter the symbol you want to trade. If the symbol is not available on Binance, an exception will be raised.
Step 1: Select Cryptocurrency and Interval
Choose the cryptocurrency you wish to analyze (e.g., Bitcoin, Ethereum) and select the time interval (e.g., 1-hour, 1-day).
Review the Results
After the analysis is complete, the tool will present you with:
- Trend Analysis: A summary indicating whether the market is likely to move up (bullish) or down (bearish), along with an explanation based on the identified wave patterns.
- Price Predictions: The tool will also provide the predicted price for the next few periods, allowing you to make informed trading decisions.
- Charts: Visual representations of the data, including candlestick charts with Elliott Waves and predicted future prices.
Make Informed Decisions
Use the insights provided by the tool to guide your trading or investment decisions. Remember that while the tool offers advanced analysis, it is always advisable to combine these insights with other forms of research and risk management strategies.