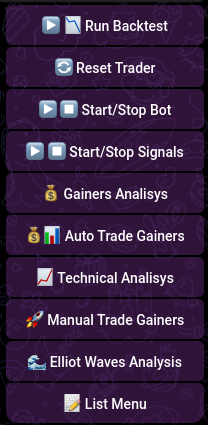
Gainers analysis

Early-Stage Gainers Detection Script Overview
This script is designed to identify early-stage gainers in the cryptocurrency market by analyzing Binance trading pairs. It fetches historical market data, computes technical indicators, and identifies potential gainers based on specific conditions such as moving averages and RSI (Relative Strength Index). The script also supports concurrent processing to handle multiple trading pairs efficiently.
Key Libraries and Imports
The script utilizes several important Python libraries:
- os: For accessing system-level information, such as CPU core count.
- requests: To make HTTP requests for fetching market data from the Binance API.
- pandas: For handling and analyzing time-series data.
- ta (Technical Analysis): To calculate technical indicators like Simple Moving Average (SMA) and RSI.
- concurrent.futures: To enable parallel processing for faster analysis of multiple trading pairs.
Script Functionality
1. Fetching Binance Symbols
The get_binance_symbols function retrieves all the trading pairs available on Binance that end with 'USDT' (indicating they are paired with Tether, a stablecoin).
2. Fetching Active Trading Pairs
The get_active_trading_pairs function fetches a list of trading pairs that are currently active on Binance. This ensures the script only processes trading pairs that are currently being traded.
3. Fetching Historical Data
The get_historical_data function retrieves historical market data (OHLCV - Open, High, Low, Close, Volume) for a given cryptocurrency symbol over a specified time interval. The data is then formatted into a pandas DataFrame for further analysis.
4. Calculating Percentage Change
The get_percentage_change function calculates the percentage change in the price of a cryptocurrency over a specified interval. This helps in identifying how much a symbol's price has moved in the given period.
5. Analyzing Data
The analyze_data function calculates two key technical indicators:
- SMA (Simple Moving Average): A 20-period moving average that helps in identifying trends.
- RSI (Relative Strength Index): A momentum oscillator that measures the speed and change of price movements. The function also identifies early-stage gainers based on whether the closing price is above the SMA and the RSI is greater than 50.
6. Processing Symbols
The process_symbol function processes each symbol individually. It fetches historical data, analyzes it using the analyze_data function, and identifies whether the symbol is a potential early-stage gainer. If the symbol meets the criteria, the function returns its symbol, latest price, initial price, and percentage change.
7. Concurrent Processing
The get_early_stage_gainers_concurrently function uses the concurrent.futures module to process multiple symbols in parallel. This significantly speeds up the analysis, especially when dealing with a large number of trading pairs.
8. Calculating Percentage Increase
The calculate_percentage_increase function calculates the percentage increase in the price of identified gainers. It also filters the results based on a specified change threshold.
9. Main Function
The fetch_and_analyze_gainers function is the main entry point for fetching and analyzing gainers based on a given interval. It identifies early-stage gainers, calculates their percentage increase, and stores the results in the session_gainers dictionary for future reference.
10. Session Management
The script includes functions for managing the session data:
get_stored_gainers: Retrieves the stored gainers list for a specific token.clear_stored_gainers: Clears the stored gainers list for a specific token.
How to run Gainers analysis
- Click on Run Backtest menu option
- Select the interval: 1h, 4h, or 1d.
- Select the threshold from the list: 0, 0.3, 0.5, 1, 2, 3. This represents the gain for the last 24 hours.